Article by ENM, author: Pille Pruulmann Vengerfeldt
© Pictures by DDS and ERM
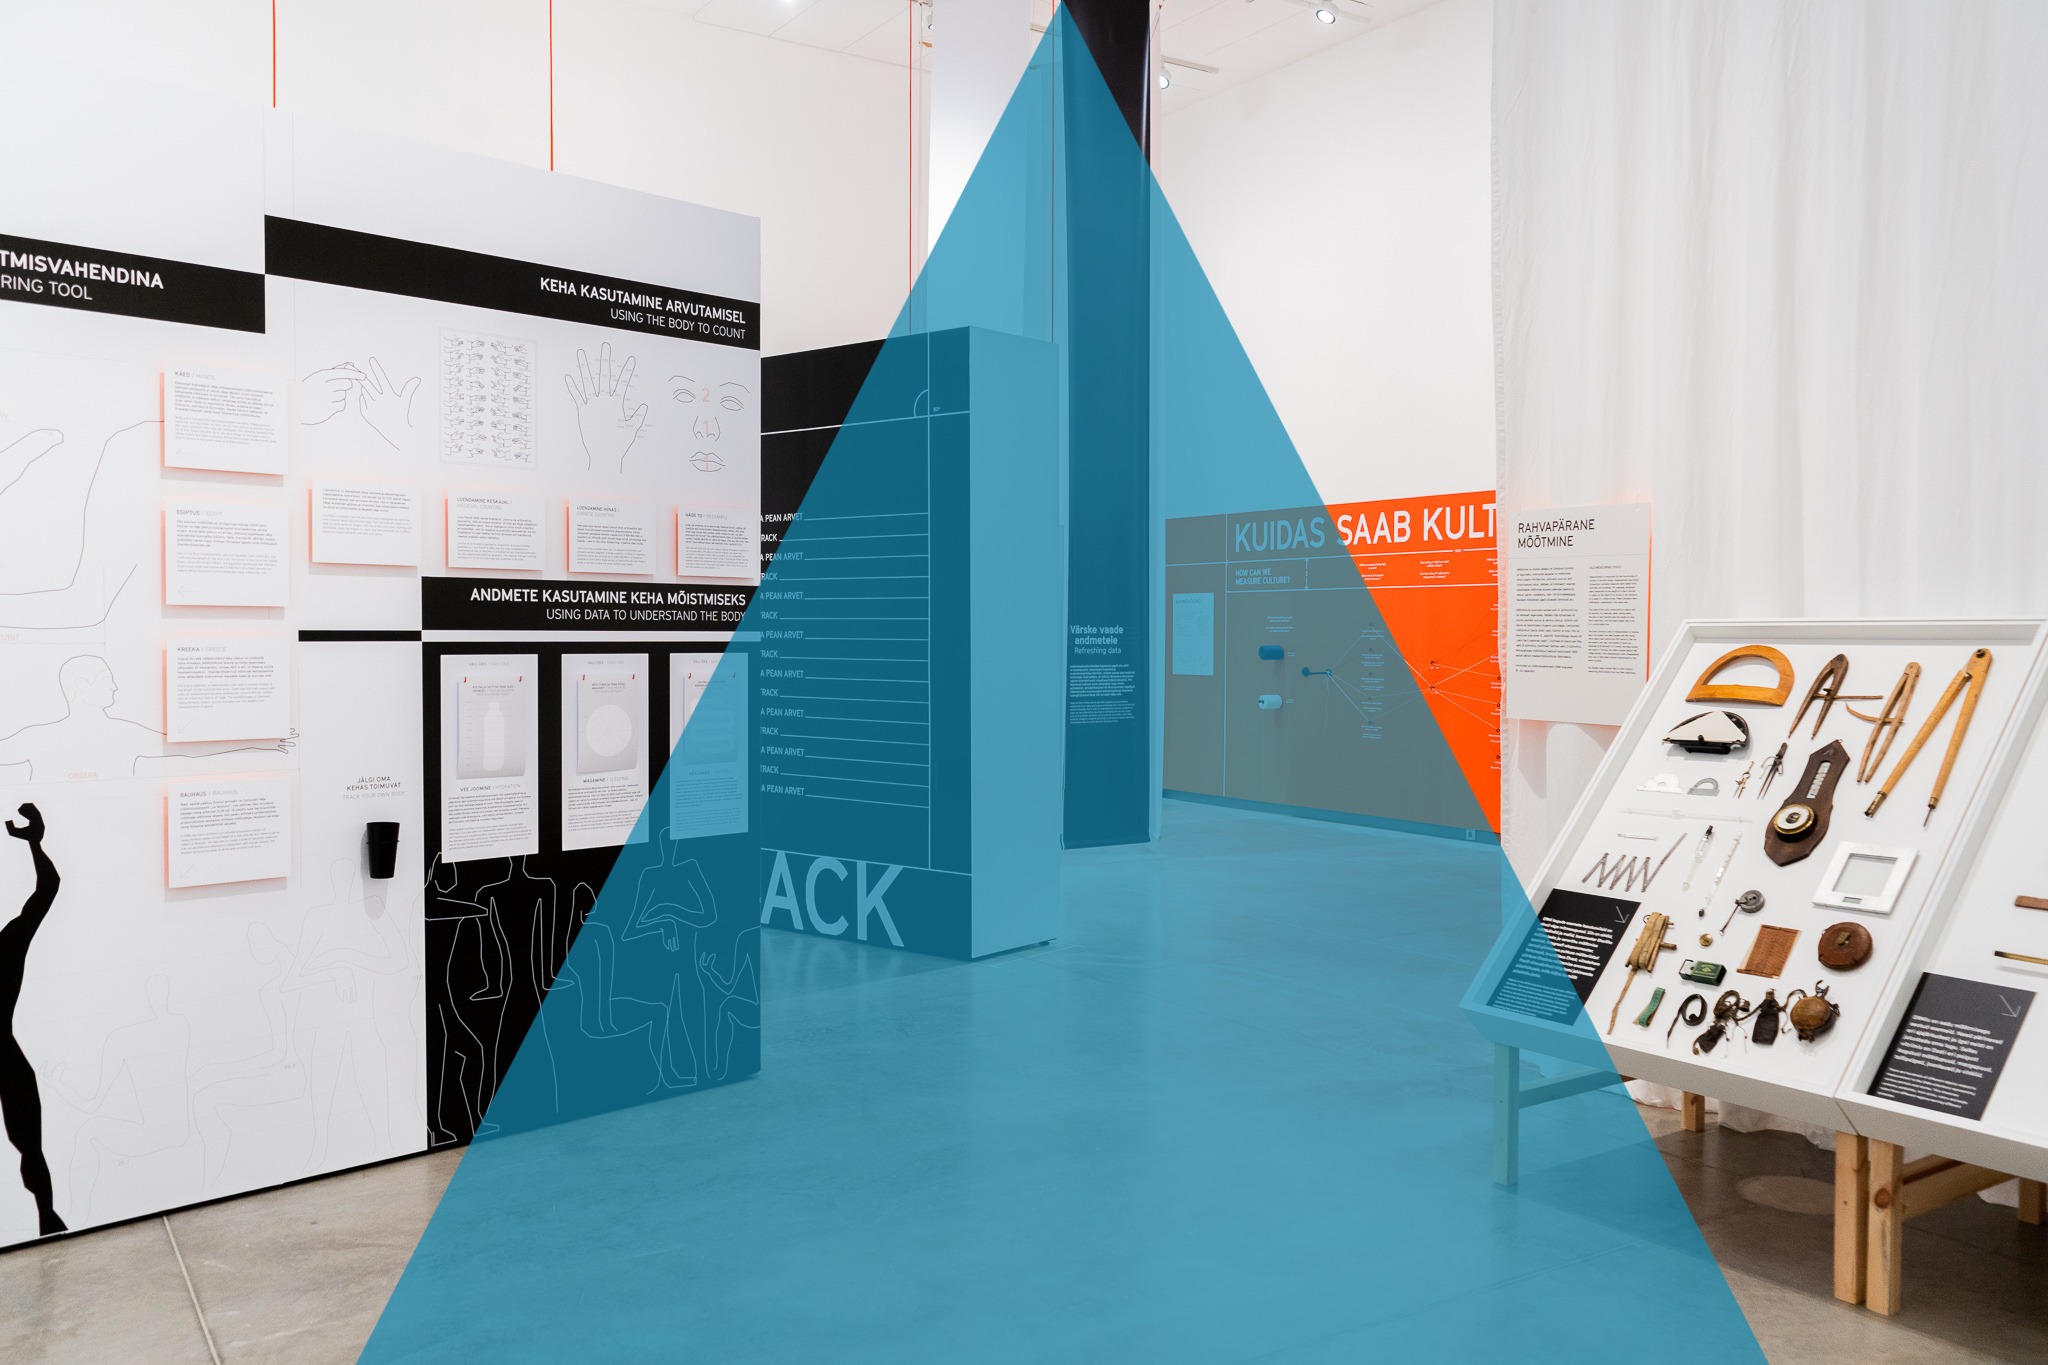
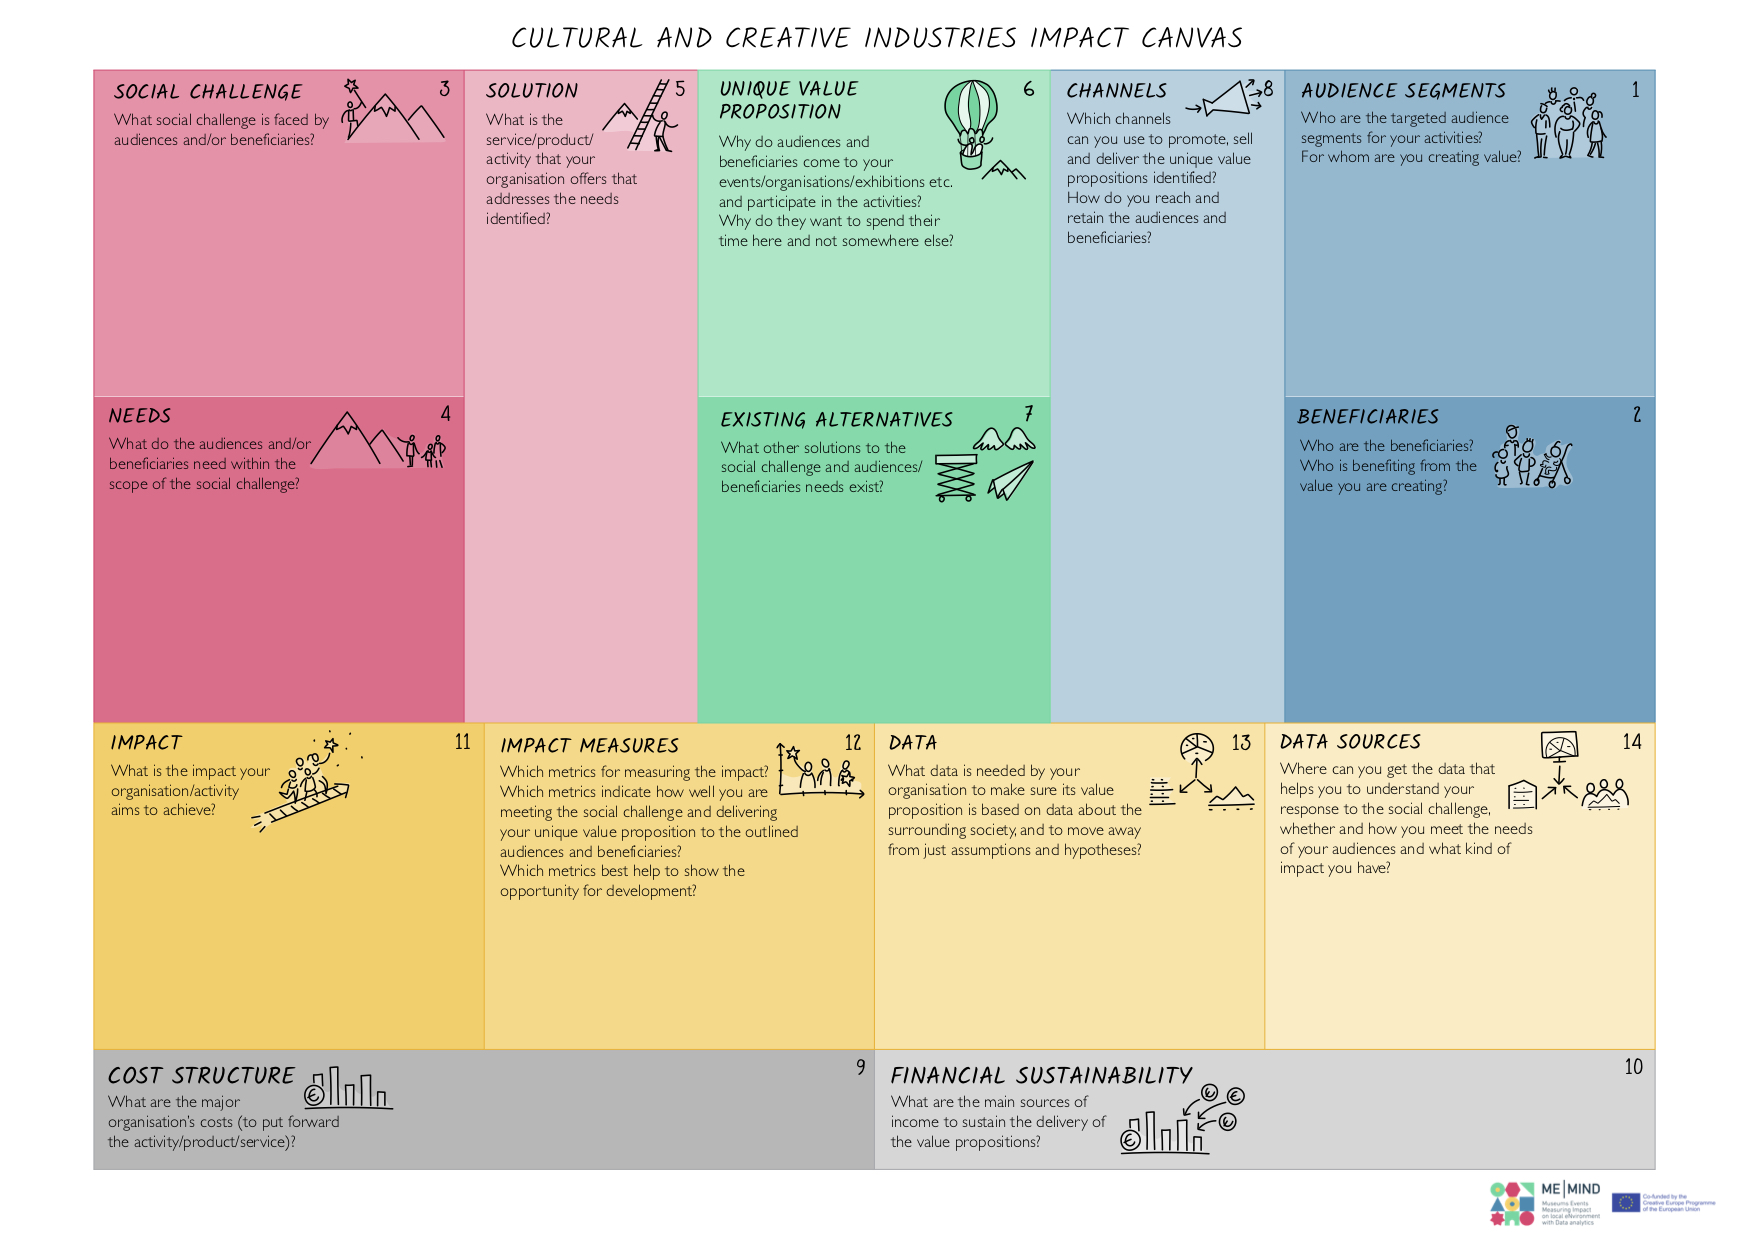
MeMind project has been seeking ways to measure and understand the impact of cultural activities and institutions. Our explorations have taken us to reflect upon the questions of data and measuring and to trace that through “Number Fascination” an exhibition in the Do It Yourself Hall at the Estonian National Museum.“People are number animals”, claim Swedish and Norweigan professors Michael Dahlen ja Helge Thorbjørnsen. Meaning that we depend on numbers when making choices and decisions almost on the subconscious level.
Did you know that numbers have gender? Did you know that numbers can influence your decision to turn right or left? I am sure you are familiar with the claim – you get what you measure or that you can’t manage what you can’t measure. Even – what you measure affects what you do; if you don’t measure the right thing, you don’t do the right thing. Different economics theorists, like Peter Drucker and Joseph Stiglitz, have been attributed to these quotes, linking decision-making and measuring. But do we measure the right things? Do we measure things that we value? And how should we measure culture? Our reflections on the number fascinations exhibition explore these ideas of measuring and valuing through four interconnected stories.
The first story – origins of counting and measuring
When entering the exhibition room, we invite the visitor to measure themselves. How tall are you? How tall are you in comparison to an average Estonian? How tall are you in comparison to the tallest man in the world? Or in the comparison of the other exhibition visitors? This is the starting point of Number Fasciation exhibithion.Since the beginning of time, our bodies have been the handiest measurement instruments, and before unified measures, we have used to measure with the span of our hand or stretch of our arms. One inch, 2,54 cm is roughly the same length as the first joint of your thumb. A spread of your hand from your thumb to the little finger is called span and is unified to mean 22.9 cm. The length of the foot, the length of the stride, the breath of the thumb and many other such measures originally relate to the body.
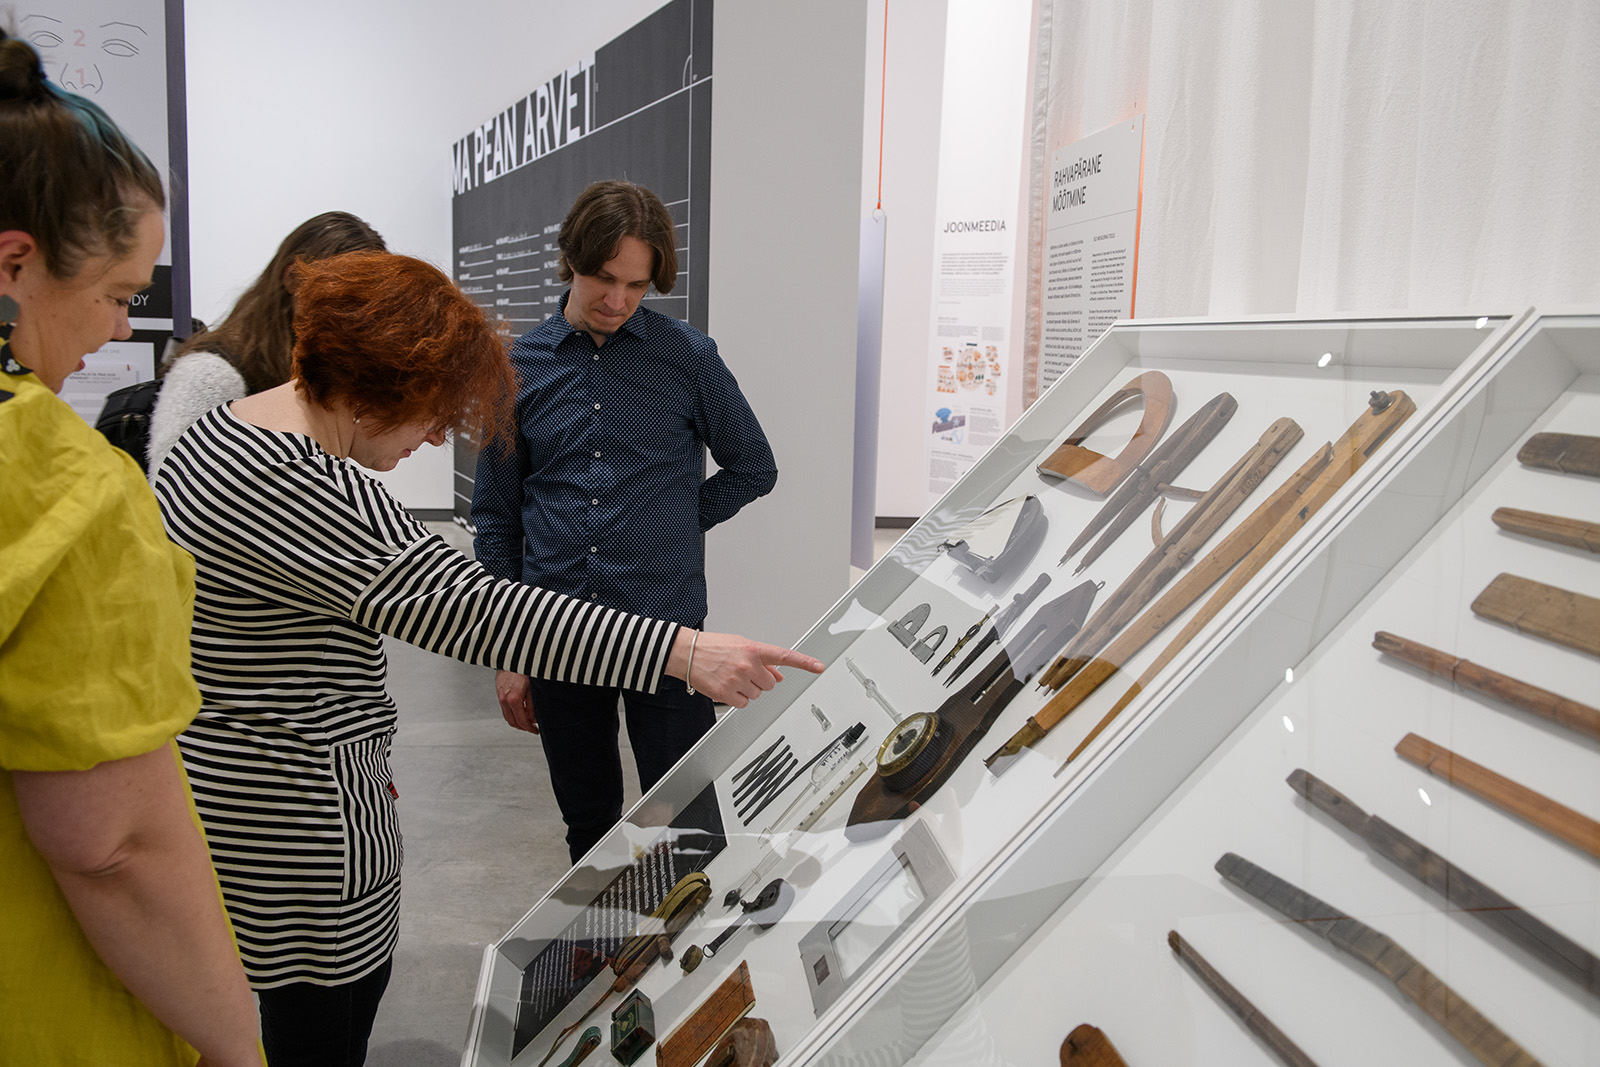
These days, they are so strongly embodied in our language that it is hard to separate the original concept linked to our bodies and the (often still used) measurement units. When we reflect upon it, we see that for a long time, our bodies have been well suited to measuring the world around us. But in recent years, we have instead started using external instruments to measure our bodily behaviours. How much water have we drunk? How many hours of sleep? How many steps per day? Thus, we have transformed from measuring things with our bodies to measuring our bodies.
The second story – (ac)counting
Approximately around the 16th century, Europeans became obsessed with data collection. People’s interest in measuring the world with their bodies expands from an individual to the public sphere – state and business world.We start counting and tracking citizens, keeping track of flows of money and goods on the level of states. Since the 19th century, states have started systematic statistics collection about their people. Mostly, the goals of such endeavours have been efficiency and bureaucratisation. It is impossible to imagine central management without detailed accounting.
In the second story, we invite our visitors to reflect upon whether we track and account right things for the right purposes. How big or how small is a country when we look at its impact in different areas instead of the territory? How big is our energy dependence in the context of climate change and energy wars? What should we keep track of in our own everyday lives? What is that we want to measure and manage?
The third story – the promise and the challenge of big data
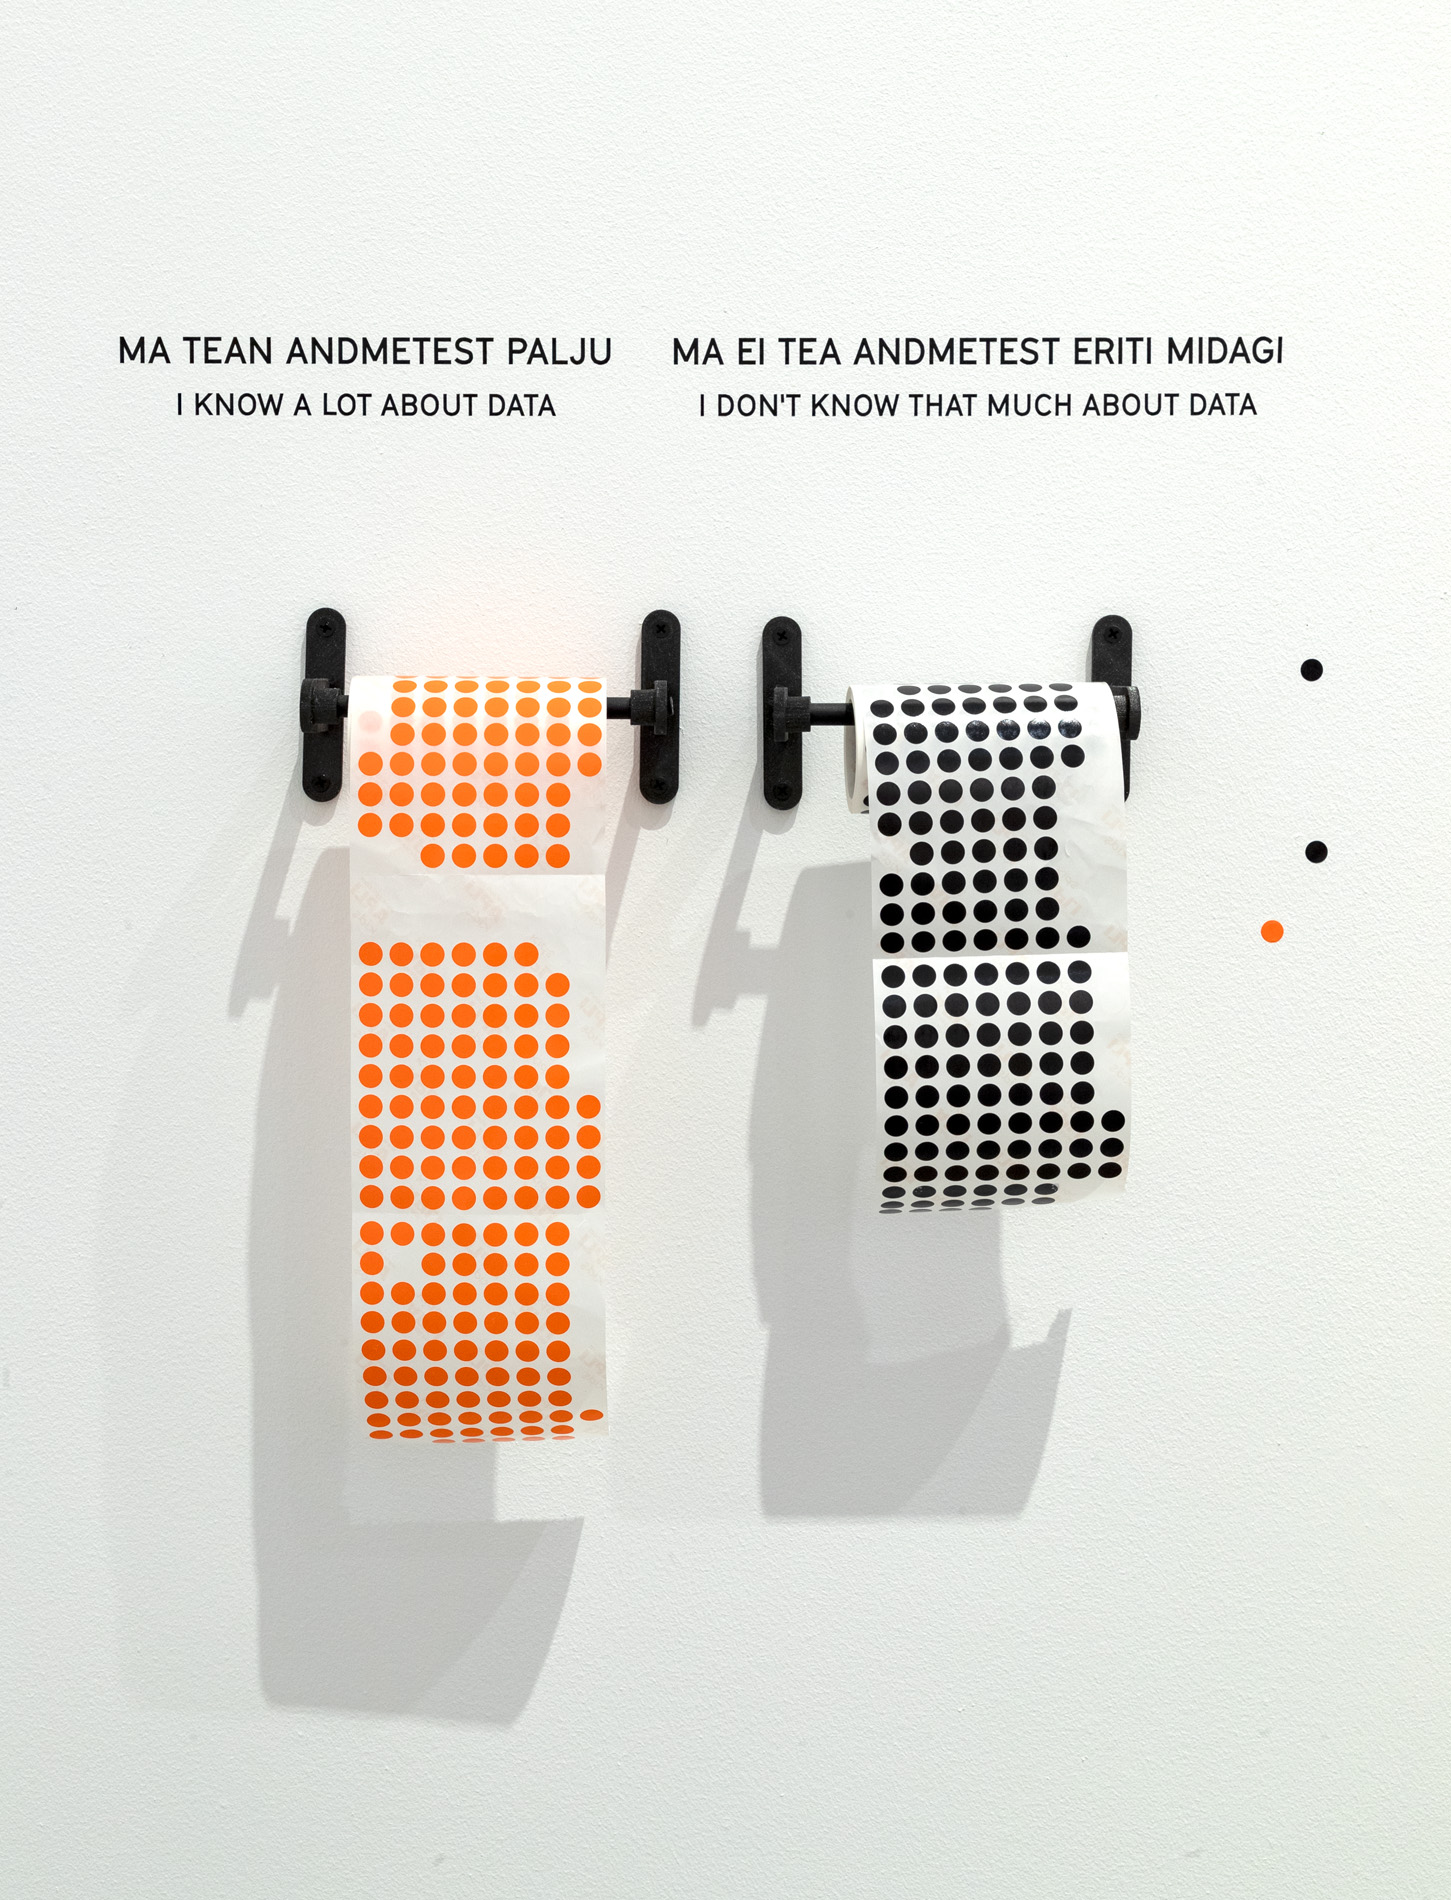
In the third story, we invite our visitors to reflect upon our increasing data fascination. Do the data that we collect in our attempts to set numbers to everything fulfil the promise? Or does the ever-present data collection challenge us in unprecedented ways?On the screens, we show some of the great Estonian, European and Global data projects that help us to understand the surrounding world in better ways. But we also show how the numbers on the social media platforms can impact us and even cause a heartbreak. How much do we know about data and measuring? Who can decide what data about us to collect and analyse? Who knows more about you – your family or your phone?
The fourth story – refreshing data
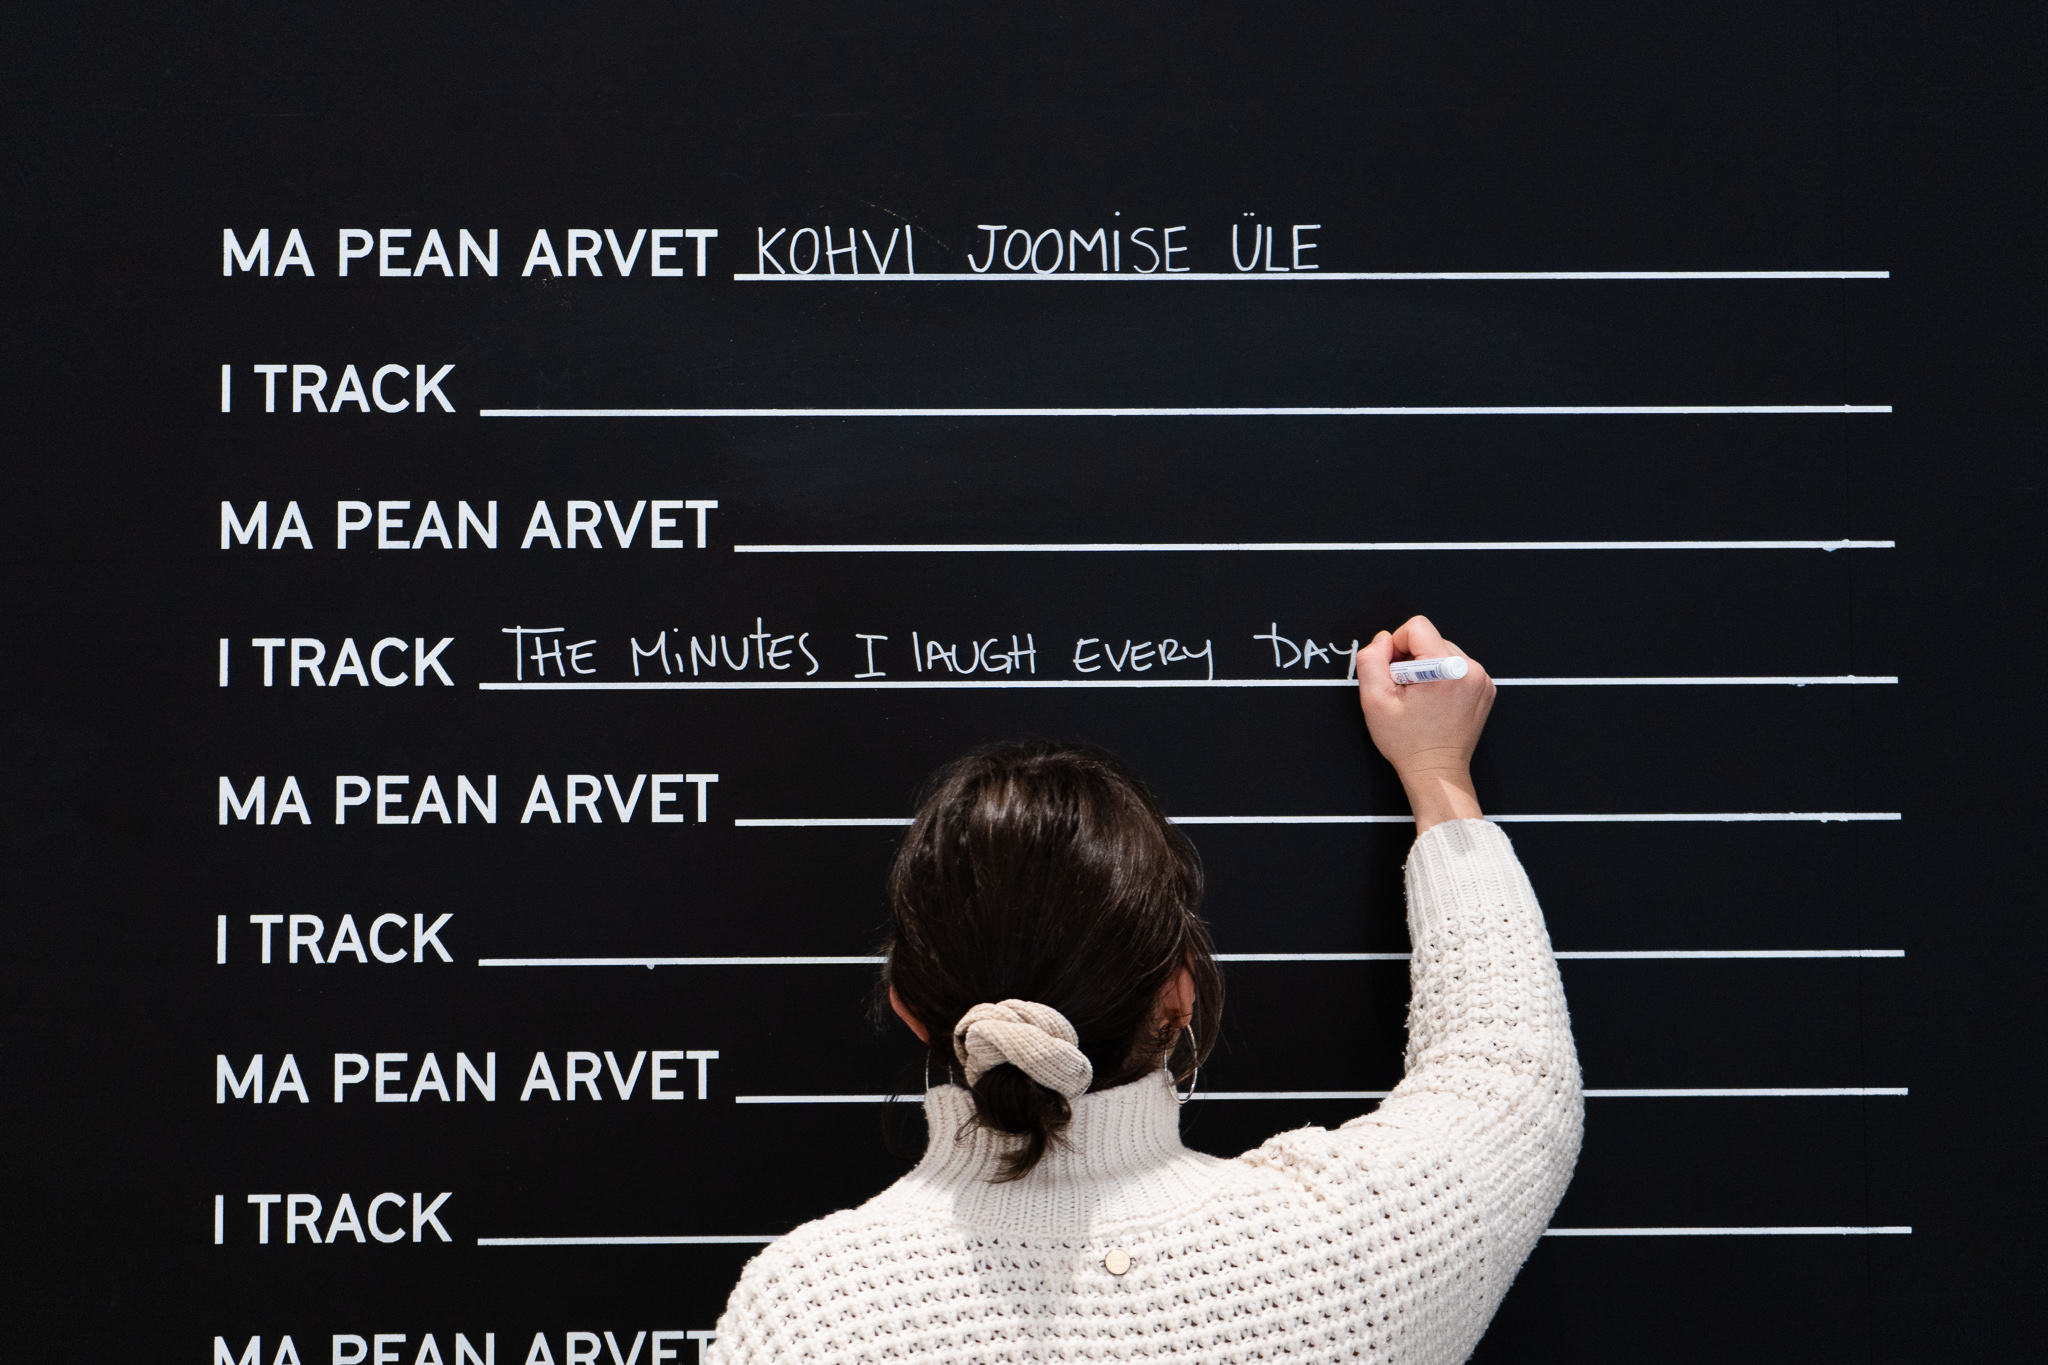
After provoking the visitor to reflect on data and measuring what we consider measurable and what we want to be measured about ourselves, we invite the visitor to the fourth story. Here we show how every one of us can become cultural statistics when we mark down our cultural spending, our books in progress and our latest cinema visits. We showcase some artists engaged in data visualisations, who try to disentangle us from the numbers, and offer a refreshing look at data. And we invite the visitor to think along – how can we measure culture?While some of the ideas behind the exhibition might not have made it explicitly to the exhibitions, the reflections, the participatory potential, and the Do-It-Yourself spirit is there. We are exhibiting a prototype, an invitation to reflection, questions, not answers set in stone. What did you last measure? When and where did you last encounter culture, and can our current data and measurement systems account for your experiences and their impact?
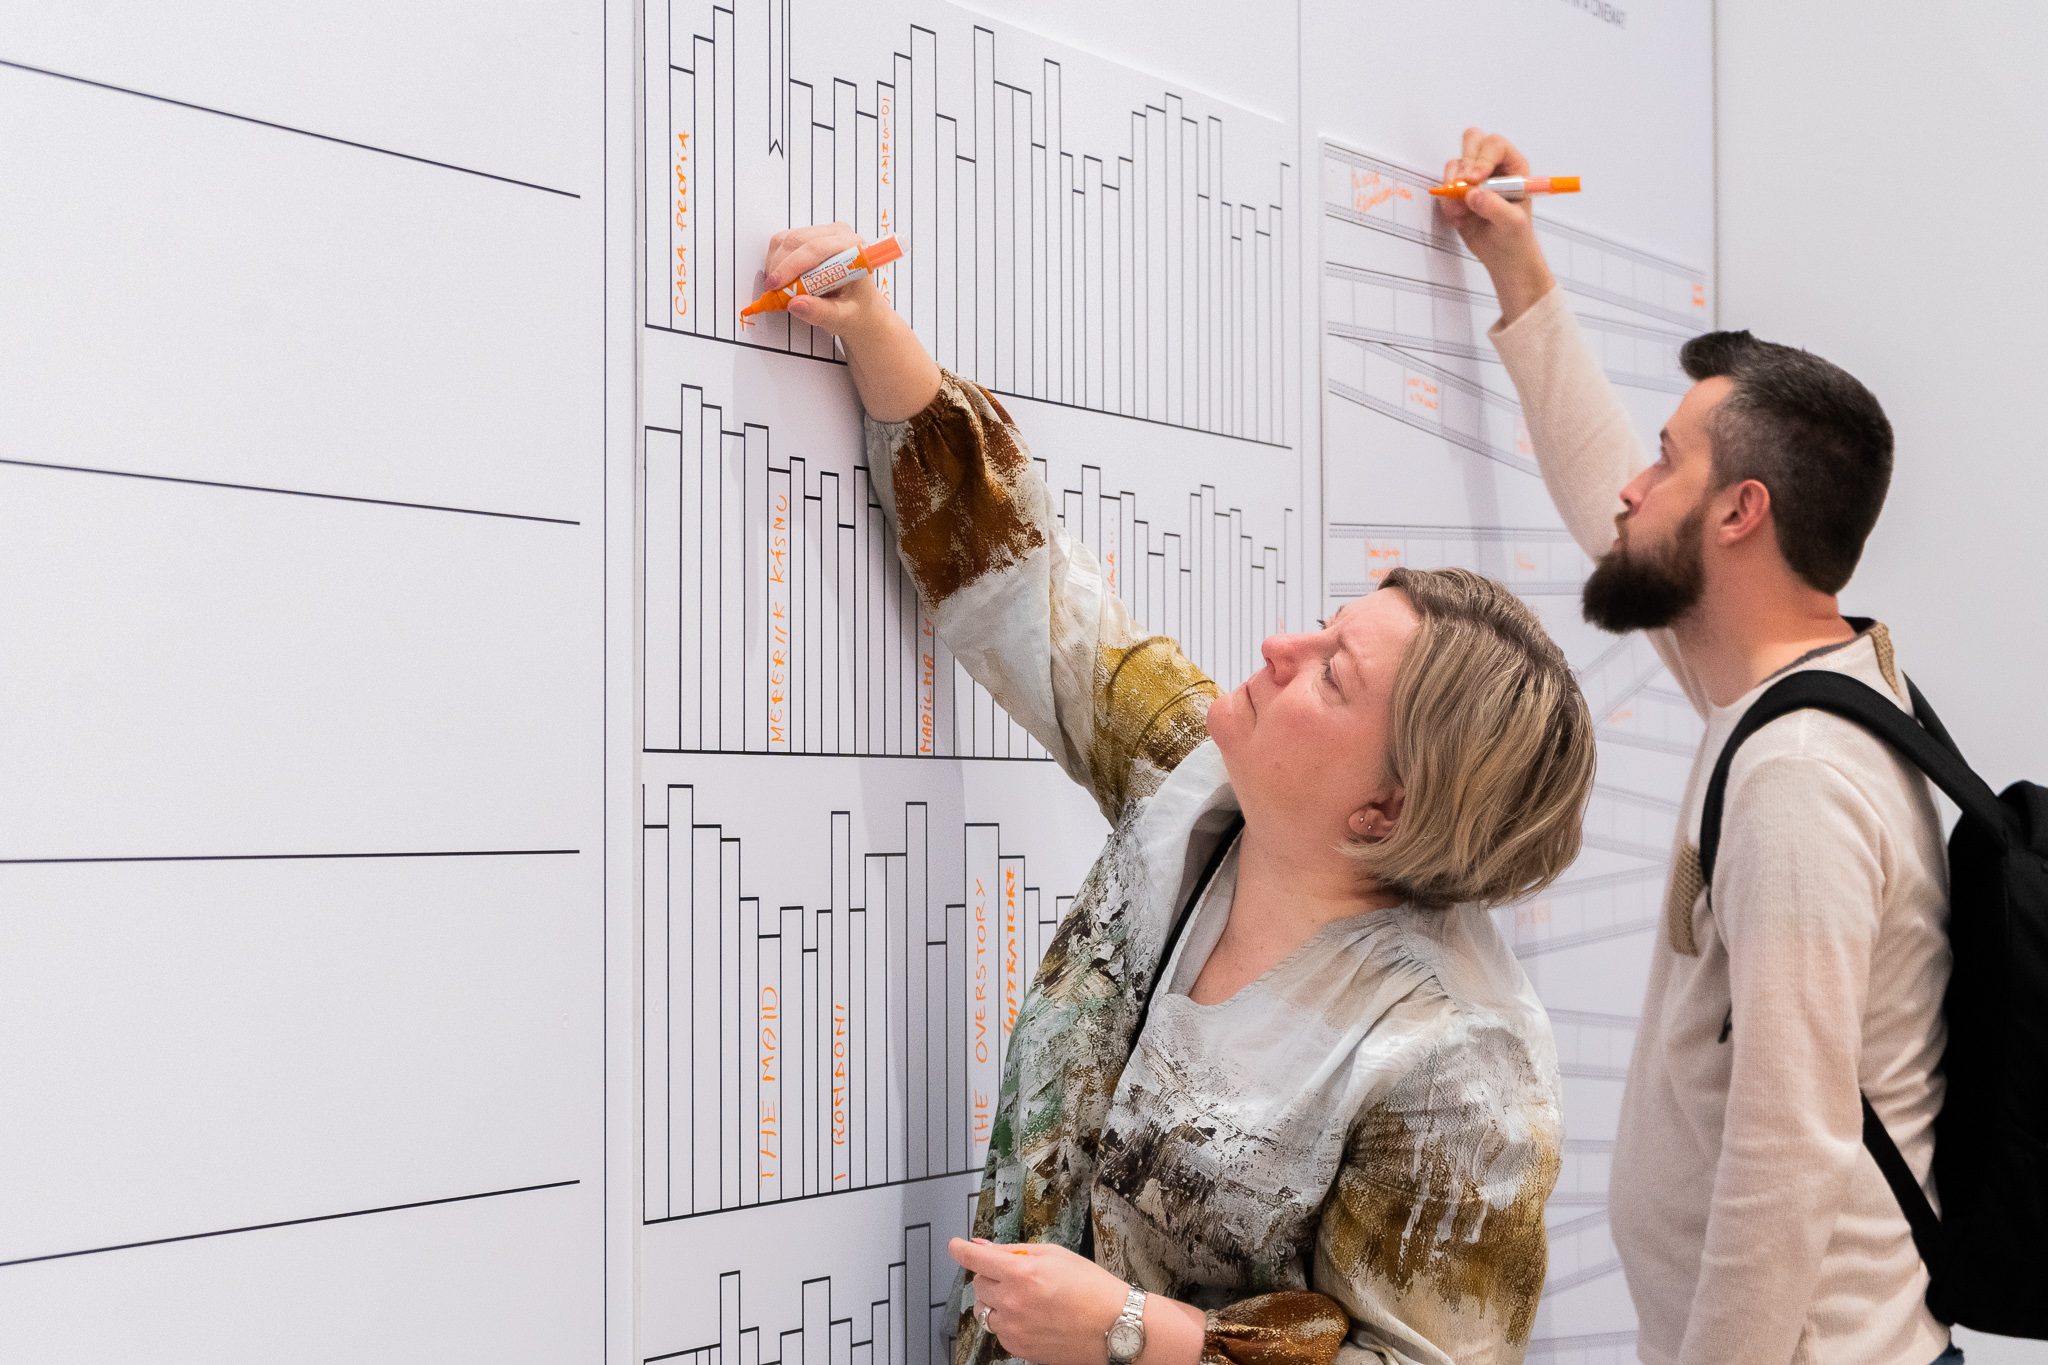 The Number Fascination exhibition communicates some reflections, concerns and ideas, but the exhibition also acts as a data-collection point where the visitors experiences become part of a more significant data collection. The exhibition prototype offers a way in which creative and cultural institutions can better communicate the data they collect and the decisions and valuations made based on the data. The communication is directed to the public, who is not interested in reading reports with numerous pie charts but whose everyday actions and choices are part of the data presented to them.

