What can we learn from data in the context of cultural institutions?
The cultural sector is in constant change. While museums ask themselves how to transform their role to avoid monologues and make their content and activity relevant to the contemporary social debate, we see new formats of cultural events emerging which success would have been difficult to predict – look at Travis Scott’s concert in Twitch during the toughest moment of the pandemic, that attracted 45 million viewers worldwide.
Data can be a great ally for cultural institutions to find answers about, for instance, what moves their audiences or what their social and economic impact is. More importantly, data can lead us to new questions that will push us to rethink the role and shape we want cultural institutions to play today and in the near future.
In this article, we point out what we have learned from the Internet Festival and the Estonian National Museum by analyzing different datasets within the framework of Me-Mind, and what new questions they spark.
Case study 1: The Internet Festival
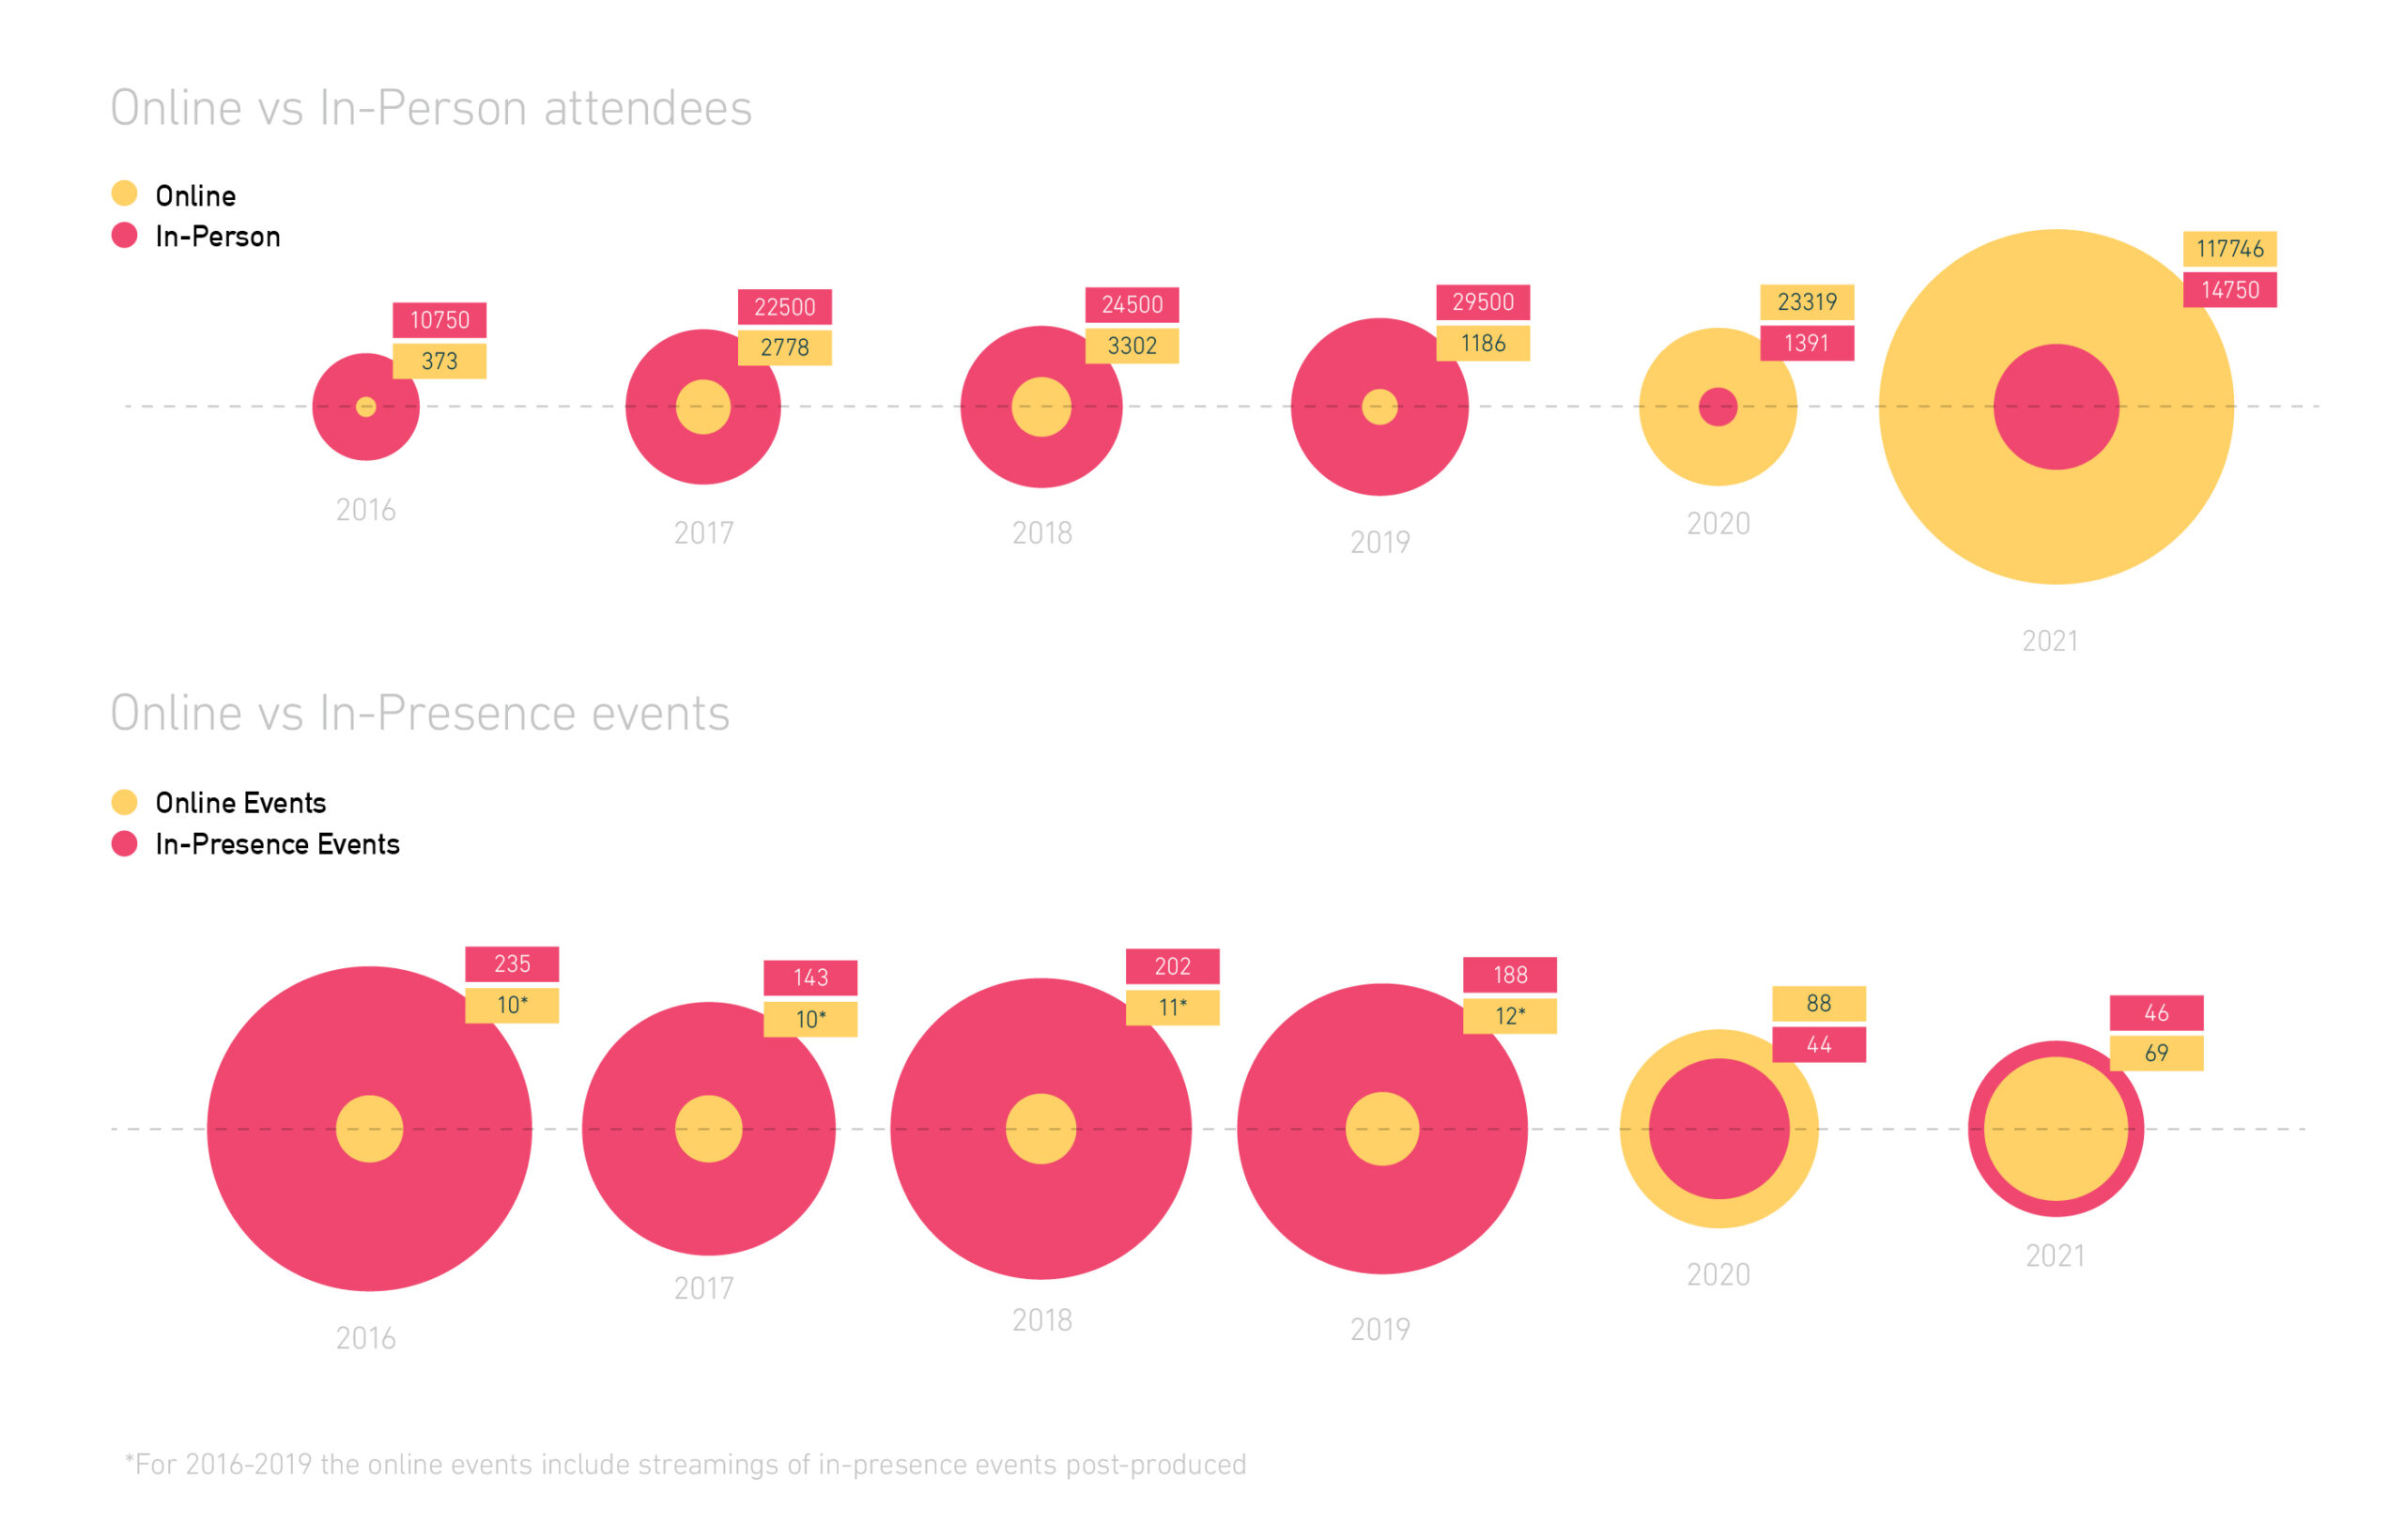
Covid-19 could not stop the on-site celebration of the Internet Festival in the worst year of the pandemic, despite the restrictions. This, added to the fact that the festival had offered the option of joining some of its physical events remotely for years, makes it an ideal event to analyze if there are traces of new trends regarding digital attendance to on-site events. We will analyze this based on internal data of the Internet Festival, collected from 2016 to 2021.

By observing the data we confirm something that seems obvious: that the restrictions due to Covid in 2020 led the festival to offer more online events than real-life ones, and participants to choose online events over on-site ones – that year online participation was 16 times greater than face-to-face.
What might be more unexpected (and that gives us clues about a possible trend that we will have to continue tracking in the upcoming years) is to see what happened with online and offline participation after most restrictions disappeared in 2021. Participation in physical events increased compared to the pre-covid period. However, this did not affect the online events which, instead of having lower participation, were not only more attended than the physical events but even quintupled compared to the previous year in terms of participation (117,746 vs 23,319).
This leads us to wonder if, despite returning to full normality, the festival should expand its efforts in its online version in the future. To decide how much effort (and resources) to invest in setting up a powerful online event, it would be interesting to track what impact the knowledge acquired at the festival had on the communities of attendees, and where they are located.
Case study 2: The Estonian National Museum
‘Encounters’ is the ENM’s main permanent exhibition, showcasing a journey through Estonian cultural history and everyday life, from the present to the Ice Age. The exhibition offers the visitor an open narrative. This means that the audience does not have to follow a predetermined order to discover the story or pieces, but can freely choose their own. Although the narrative is designed to make sense in any order, the fact that we’re speaking about a timeline helps visitors to situate themselves in the different periods and topics. For those who prefer to be guided by space, the museum offers some pathways by theme and interests.
The principle at the base of the ‘Encounters’ exhibition is dialogue. This notion was used both as the theoretical underpinning for the exhibition concept as well as a practical exhibition creation method (in terms of spatial design). The museum interpreted “dialogue” as a principle that would not try to discover the one and only meaning of a cultural phenomenon and would stress the natural multivocality of culture.
Conceptually, visitors are seen as active partners who can dialogue with the space to understand its cultural heritage as common and shared. At a space level (3,500 m2, with two entrances), as it was an exhibition impossible to see in a single day, it was necessary to propose a flexible story.
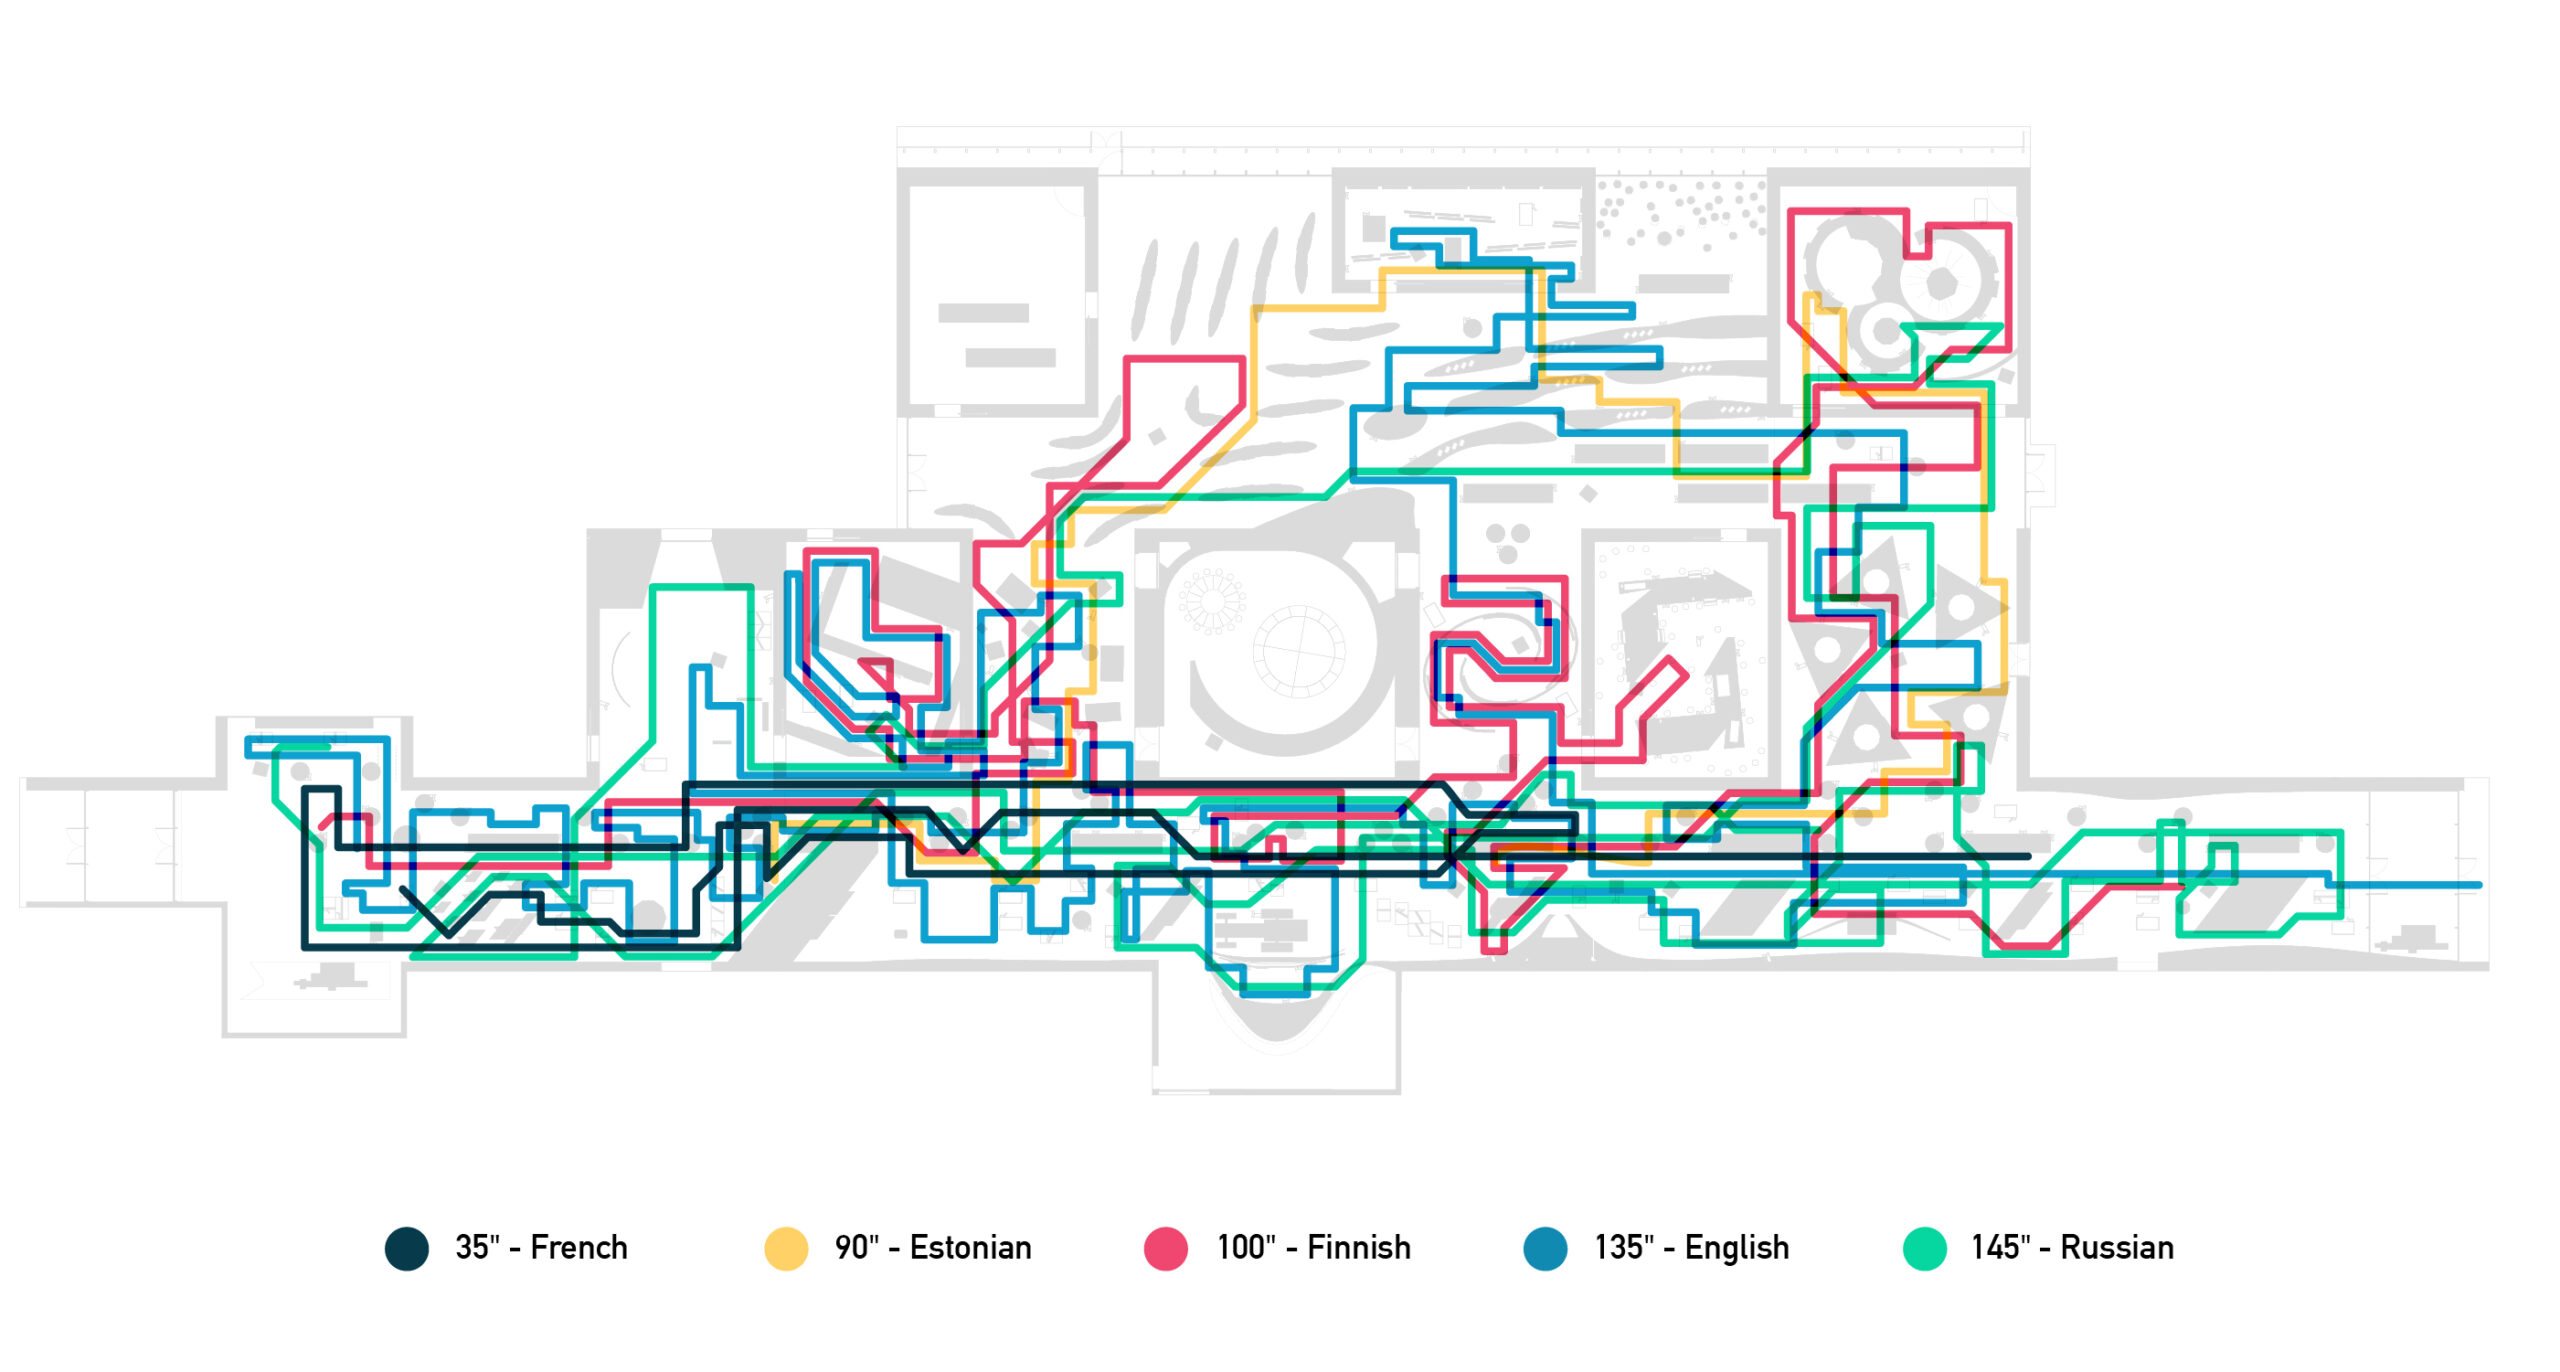
Thanks to E-Tickets, an interactive system through which the audience can activate the placard of any piece in their preferred language, the museum knows where each visitor has stopped. The following visualization shows the paths of 5 different visitors inside the ENM.

The data from this visualization allows us to verify that each of these 5 randomly chosen users has been able to create their own path, not only based on their interests, but also on the time they had.
There are two questions that this graphic inspires and that we could investigate further to clarify if open narratives can be considered an effective tool to turn a museum into a space for dialogue:
- Based on quantitative data: Can the information on the most visited pieces help us think of new pathways that had not been considered by curators when the exhibition was conceived? If there are such pathways, how could we capture and make visible such co-curatorship also to other the museum’s visitors?
- Based on qualitative data: Can we ask the visitors of different museums with open and closed narrative models, and with a greater or lesser degree of interactive features, what do they consider as elements of dialogue and why?
To continue finding both answers and new questions, data collection, analysis, and visualisation by cultural institutions is key. Me-Mind has developed guidelines for small and medium-sized cultural organizations at the crossroads of culture, creativity, and entrepreneurship, which are interested in learning how to better use data for impact measurement and communication that you can access here.
