Smart Business: 3 steps to becoming a Data-Driven Organisation
Several commercial solutions are available that allow big Cultural and Creative Industries to use data analytics techniques to monitor visitor flows and to transform in a smart business. What is missing is the awareness and the mental attitude to use data analytics in all CCIs processes especially in the case of small and medium CCIs.Digital data transformation should not be imposed by applying a specific technology, but it must be internalized. Awareness in the use of technology is as important as the effective details of specific technologies.
These are the considerations that have led the consortium of Me-Mind to define a journey that aims to produce both data driven awareness and at the same time directly intervene on operational processes of CCIs.
The use of data by organizations to improve the efficiency of their operations and drive innovation is nothing new. Since last century, organizations have adopted data management techniques to get more information and values from their assets, both physical and human. In the last decade, because of the advances in Information and Communication Technologies a new discipline, called Data Science, emerged. As a result, we have seen the development of new methodologies and techniques as well as new sources and forms of data that are changing the forms of innovation inside organizations.
Data science’s innovative approach has led to the idea of data driven organizations. Treating data as a resource which is only relevant to specific parts of organizations will limit the potential for developing insights that can feed into innovation and support the decision making process. Data-driven organizations are committed to gathering data with respect to all features of the activities performed. By enabling the organization at every level to use the right data at the right time, data can foster effective decision-making and become the essential component driving the innovation of organizations. However, despite having data, the number of organizations that efficiently use data and that successfully transform themselves into data-driven organizations is still limited especially for small and medium enterprises and organizations managing cultural events as well.
The technologies to transform CCIs into data-driven organizations are available. However, the journey to transform a creative and cultural organization into a data-driven organization can be fraught with difficulties. Indeed, it may become especially complicated in the case of organizations operating in the cultural and creative market. Such organizations often get excited about data and analytics in the context of a cool project but they often lack the special attitude that recognizes data and data insights as key ingredients of the business processes and, hence, they revert to old processes when the project is over. In other cases, organizations recognize the advantages of data-driven solutions and try to tackle a really hard problem right out of their skills and they get discouraged if no visible impact is quickly obtained.
The idea we followed in the ME-MIND project is to be patient and disciplined to support the hard but fruitful path to becoming a data-driven organization. The journey from an organization with data to a data-driven organization, however, is not a jump but rather an evolution over a long period. This development occurs through phases and the ME-MIND project supports this process by creating a controlled experimentation platform as well as by supporting the development of a data-driven mindset of people. The phases of such transformation are listed below.
First step
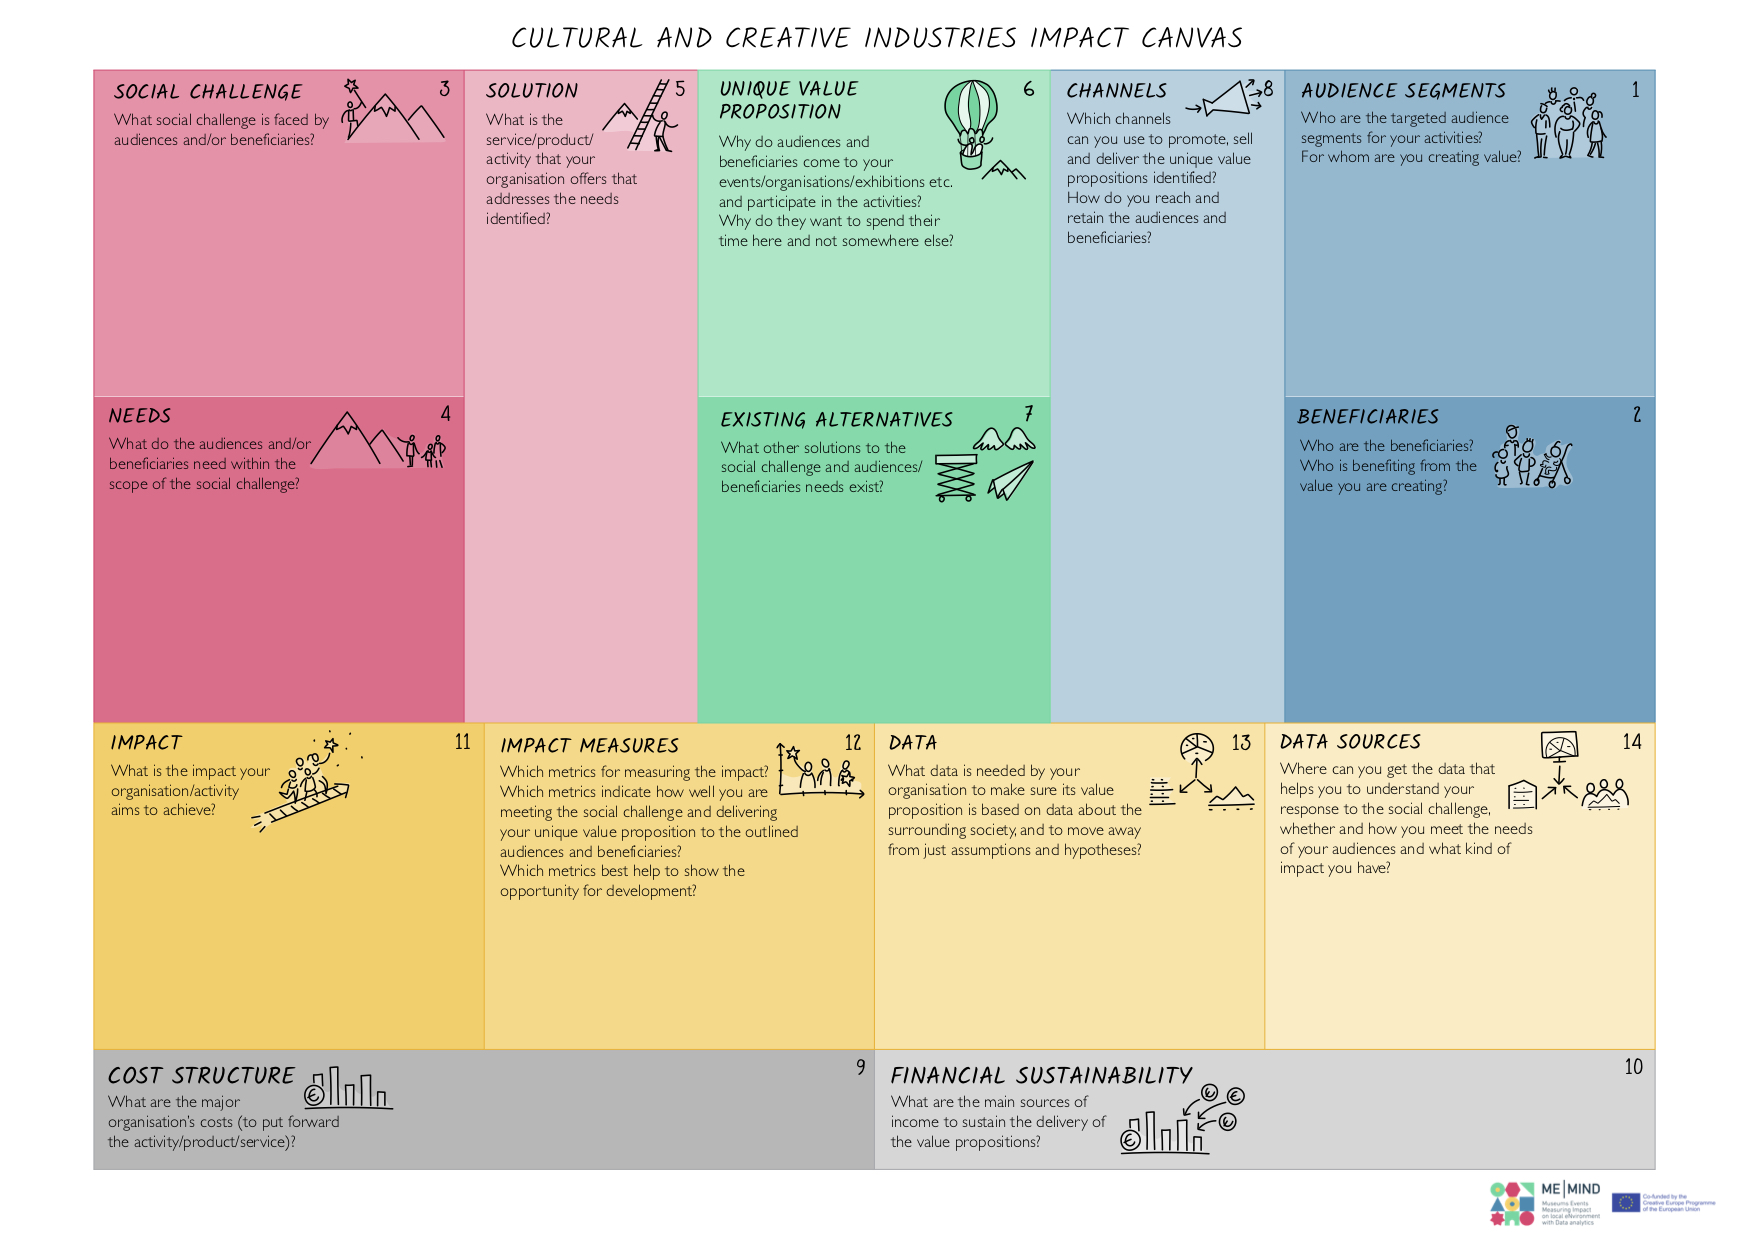
Each organization in the journey to get to the data-driven land has to face the need to identify the most essential things to its mission. This is what the consortium did by identifying an indicator framework. The framework has to be properly understood as the logical representation of the key issues that drive the activities of organizations operating in the cultural market. Specifically, the indicator framework establishes the reference context for the analysis one wishes to consider.Second step
The second step is to transform data into valuable insights that inform an organization’s strategic and tactical decisions. In the project to address this step and to help the development of the cultural mind-set that allows people to measure and extract values from data, a standard business intelligence technologies (BI-Techs) has been adopted. BI-Techs support people to access, integrate and analyze data coming from multiple, different and heterogeneous data sets. Moreover, BI-Techs allow organisations to develop analytical measures in terms of reports, summaries, dashboards, graphs, charts and maps. These provide organizations with an overall detailed insight about the state of the business.In performing the second step, the consortium also identified the main cultural and technological weaknesses. Both use cases of the project, the Internet Festival organized by Fondazione Sistema Toscana and the Estonian National Museum, typically use combinations of ICT technologies to manage data. Also, they are empowering their skills on business-intelligence and data science techniques to perform ad-hoc analyses. However, data integration methodologies and the related toolkits are not fully considered. Data integration is critical to ensure a seamless, reliable flow of high-quality data and content. Indeed, it would be easier to collect and integrate data in the meanwhile it originates and while carrying the actual activities, rather than afterwards.
The strategy of adopting business intelligence analytic service has also been exploited to make the two use case organizations aware of the actual efforts needed to collate, manage, and analyze data taken from a variety of sources even if these data are internal data. The consortium intent is to show that the ability of pulling data together and processing them, permits to transform raw data into intelligible insights. The outcome of the second step has further advantages. First it allows us to generate and share clear and useful snapshots of what’s happening in the activities of the organizations rather quickly. Second, it enables organisations to be trained in the culture of data measurement. Finally, we note that the adoption of a standard business intelligence analytical service also supports the easy exploration of a presentation layer by interactive dashboards and forms of OLAP-like data exploration experiences.
Third step
As expected, standard business intelligence analytical services provide insights into the current state of the organizations. This gets to the key distinction between business intelligence and another, related term, business analytics. Business intelligence is descriptive, telling what is happening now and what happened in the past to get the organization into a certain state of affairs. Business analytics can tell the organization what one should be doing to create better outcomes. The Business Analytics process exploits statistical methods and technologies for analyzing historical data taken both from internal and external datasets in order to gain new insight and improve strategic decision-making. This is the third step of the journey that we will address in the remaining phases of the project.General tips & techniques
The transformation of a business intelligence dashboard into a business analytics dashboard requires several steps we briefly outline above. The main techniques we are going to explore as Me-Mind project are:- Data mining. Data Mining techniques that allow us to identify trends and establish relationships.
- Text Mining. Text mining explores and organizes large, unstructured text datasets for the purpose of qualitative and quantitative analysis.
- Predictive Analytics. Predictive analytics uses a variety of statistical techniques to create predictive models, which extract information from large multiple datasets, identify patterns, and provide predictive scores.
- Data Visualization. Data Visualization provides visual representations such as charts and graphs for easy and quick data analysis.

